01
The Challenge
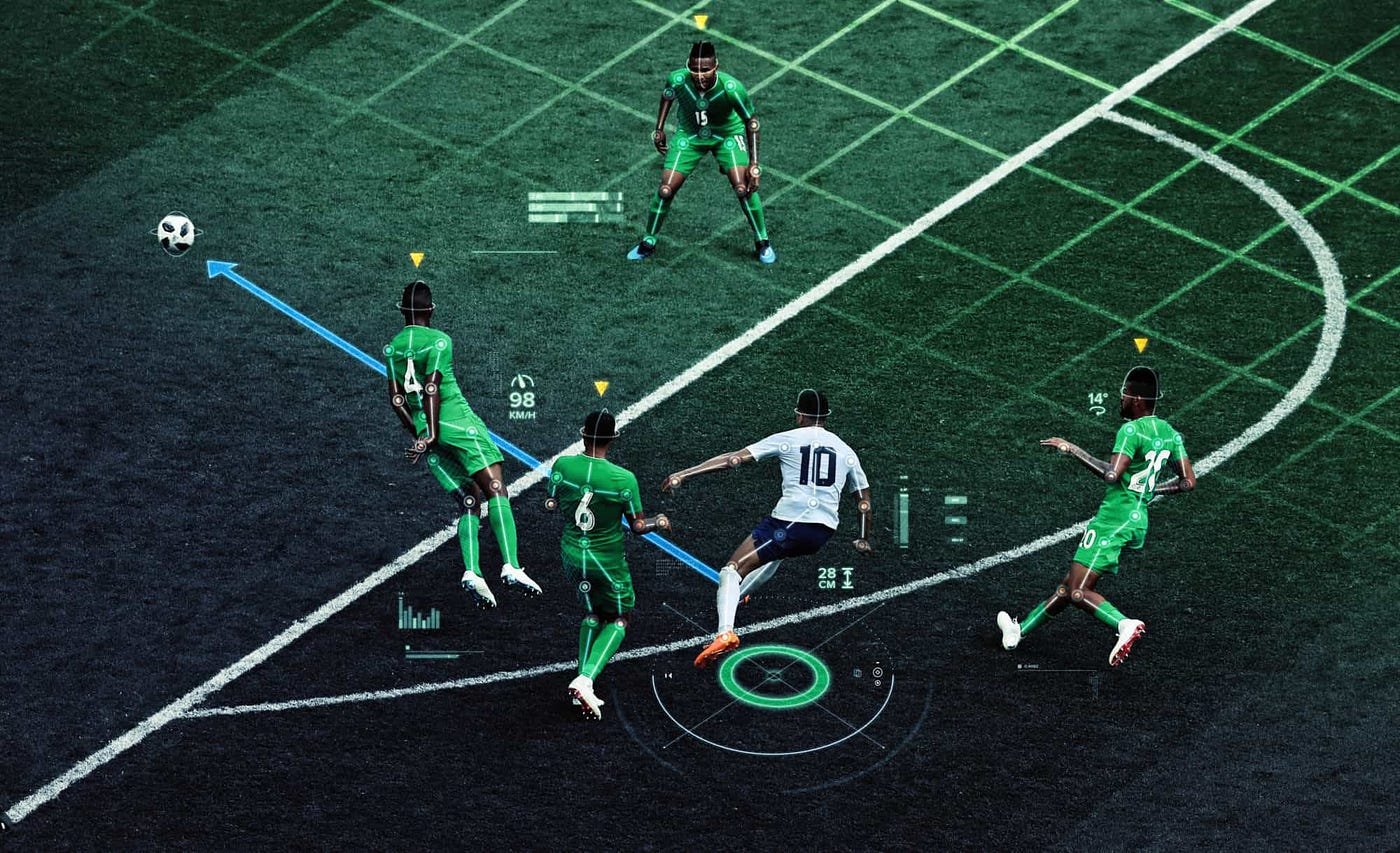
A regional football club approached me to bring professional-grade data analysis to their squad. They had access to basic match statistics but lacked the tools and expertise to extract actionable tactical insights. The coaching staff needed visualizations they could actually use during team meetings — player comparisons, passing patterns, shooting efficiency — to make data-driven decisions on formations, substitutions and recruitment.
02
The Solution
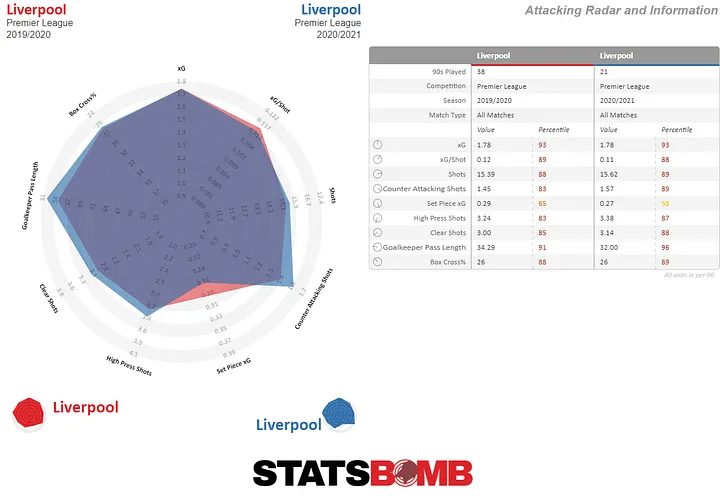
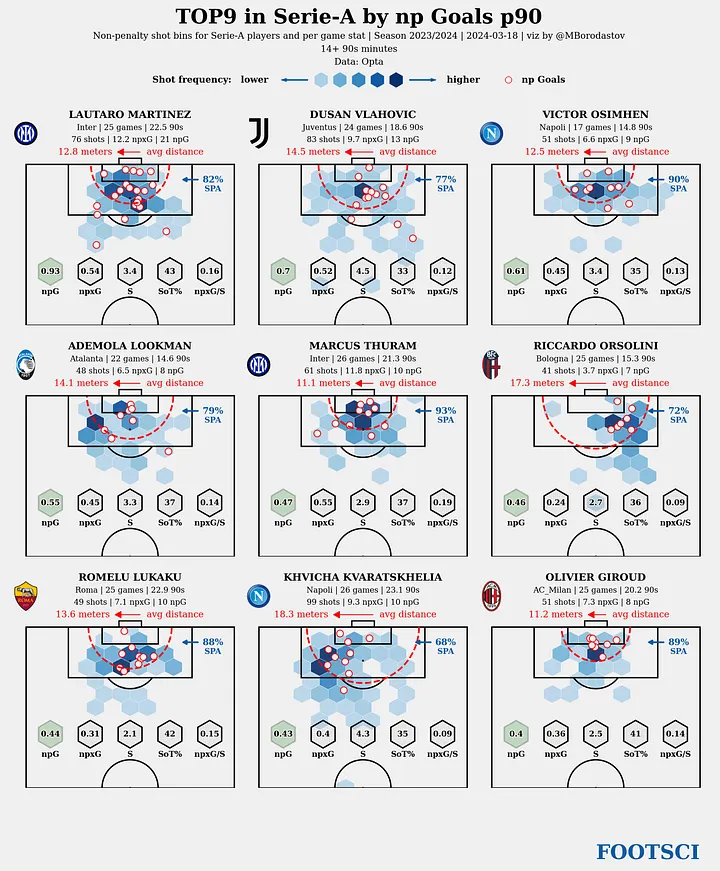
Built a complete analytics pipeline inspired by professional sports science workflows. Scraped and aggregated match data from FBRef, then developed a suite of Python-based analysis tools: StatsBomb-style radar charts for multi-dimensional player profiling across attacking, defensive and possession metrics; passing network maps with expected threat (xT) overlays to reveal build-up patterns; shot maps ranked by expected goals (xG) per 90 minutes; and comparative reports normalizing player stats by position and league percentile. Delivered all outputs as digestible visual reports the coaching staff could review before each match.
# Player radar chart — percentile-based profiling
def build_player_radar(player: str, df: pd.DataFrame):
    metrics = [
        "goals_p90", "xG_p90", "key_passes_p90",
        "progressive_carries", "tackles_won_pct",
        "interceptions_p90", "pass_completion_pct",
        "aerial_duels_won_pct"
    ]
    values = []
    for m in metrics:
        pctl = percentileofscore(df[m], df.loc[player, m])
        values.append(round(pctl, 1))

    radar = Radar(params=metrics, min_range=[0]*8,
                  max_range=[100]*8)
    fig, ax = radar.setup_axis()
    radar.draw_circles(ax, facecolor="#0a0a0a")
    radar.draw_radar(values, ax,
        kwargs_radar={"facecolor": "#2d6a4f", "alpha": 0.6})
    return fig
↳ Percentile-based radar chart using mplsoccer for multi-dimensional player profiling